Export events#
Coded events can be exported in various formats.
Export events in tabular format#
Observations > Export events > Tabular events
This function exports the events from selected observations to one or more files. Various formats are available:
-
Plain text in tabular format
- Tab Separated Values (TSV)
- Comma Separated Values (CSV)
- Hyper Text Markup language (HTML)
-
Spreadsheet files
- OpenDocument (ODS)
- Microsoft Excel (XLSX, XLS)
-
Pandas dataframe (to be loaded in Python with the pickle module)
-
R dataframe (to be loaded in R with readRDS function)
If many observations are selected, BORIS will ask you to choose a directory in which to save the files. For spreadsheet formats (XLSX and ODS), the events can be exported to multiple worksheets within a single workbook. All these formats are suitable for further analysis.
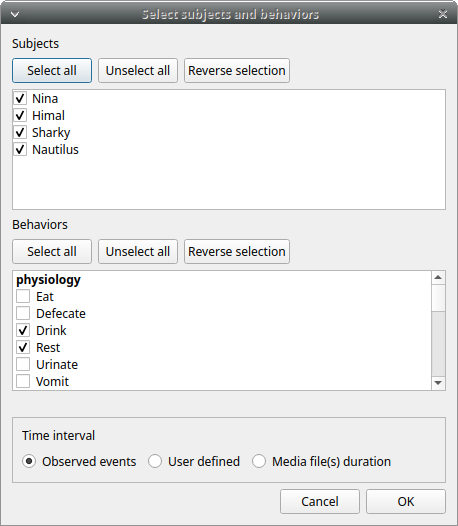
Select the subjects, the behaviors and the time interval.
Set the time interval to Observed events.
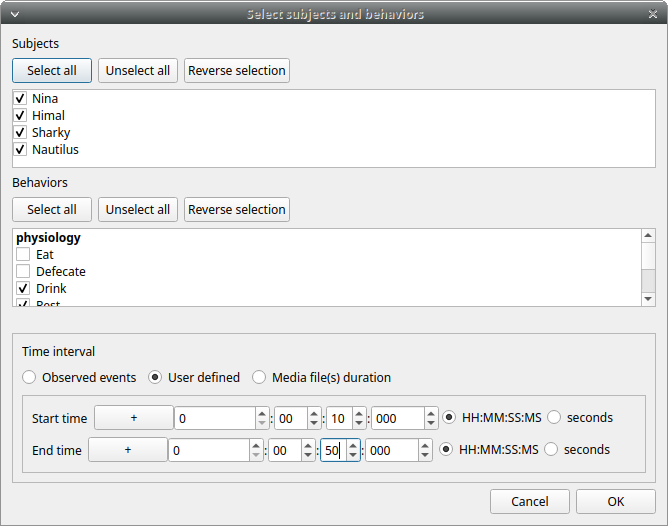
Select a User defined time interval.
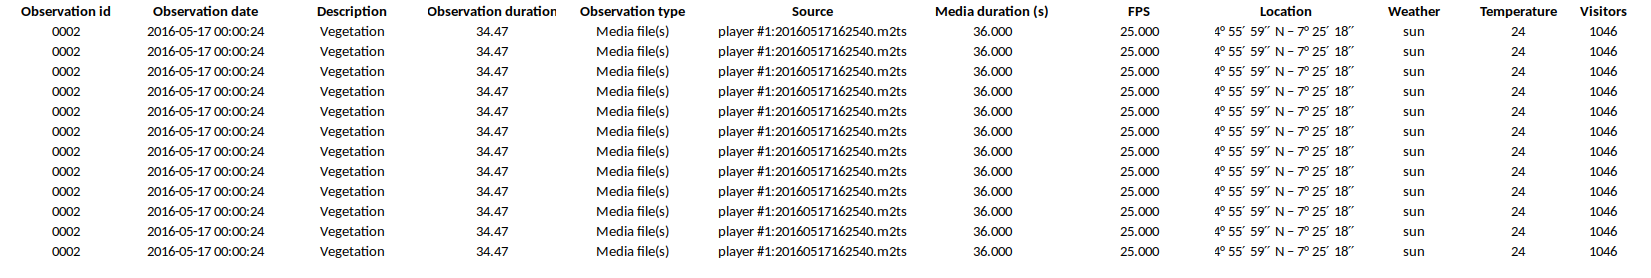
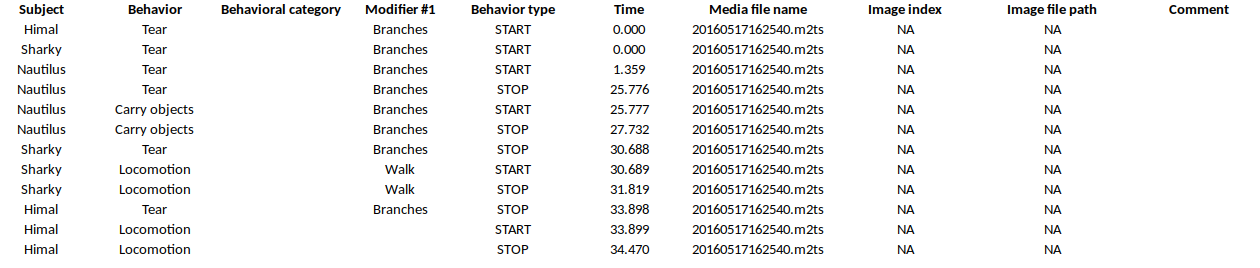
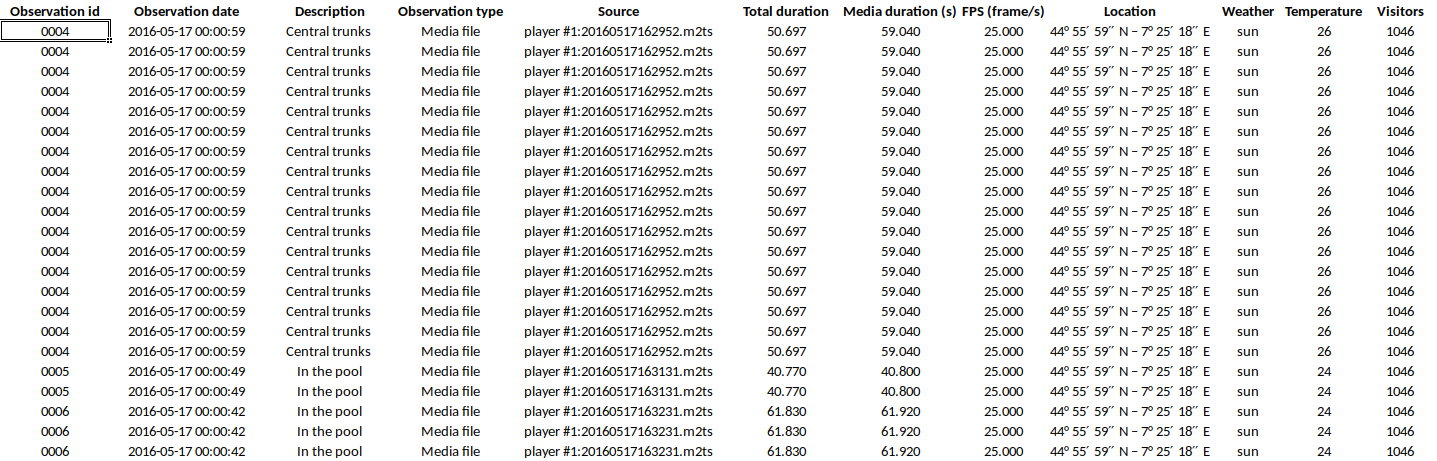
Example output of tabular events:
Export aggregated events#
Observations > Export events Aggregated events
This function exports the events corresponding to the selected subjects and behaviors from the selected observations.
Various formats are available:
-
Plain text in tabular format
- Tab Separated Values (TSV)
- Comma Separated Values (CSV)
- Hyper Text Markup language (HTML)
-
Spreadsheet files
- OpenDocument (ODS)
- Microsoft Excel (XLSX, XLS)
-
SQL format for populating a SQL database
-
SDIS format for analysis with the GSEQ program available at http://www2.gsu.edu/~psyrab/gseq
-
Pandas dataframe (to be loaded in Python with the pickle module)
-
R dataframe (to be loaded in R with readRDS function)
If two or more observations are selected, you can choose to group all results into one file. If you do not want to group the results, BORIS will ask you to choose a directory in which to save the files (the observation ID will be used as the file name).
The State events are paired and in this case the event duration is available.
An arbitrary time interval can be selected by checking the Limit to time interval option. In this case, ongoing events will be started at the start time and stopped at the end time in the export file.
The following fields are available in the output:
- Observation id
- Observation date and time
- Observation description
- Observation type (Media file / Live / Pictures)
- Source (for media file and pictures)
- Total duration (in seconds, the duration of the observation based on the selected time interval)
- Media duration(s) (in seconds, for media file observation)
- FPS (frame/s, for video file, number of images per second)
- Independent variables (one column per variable)
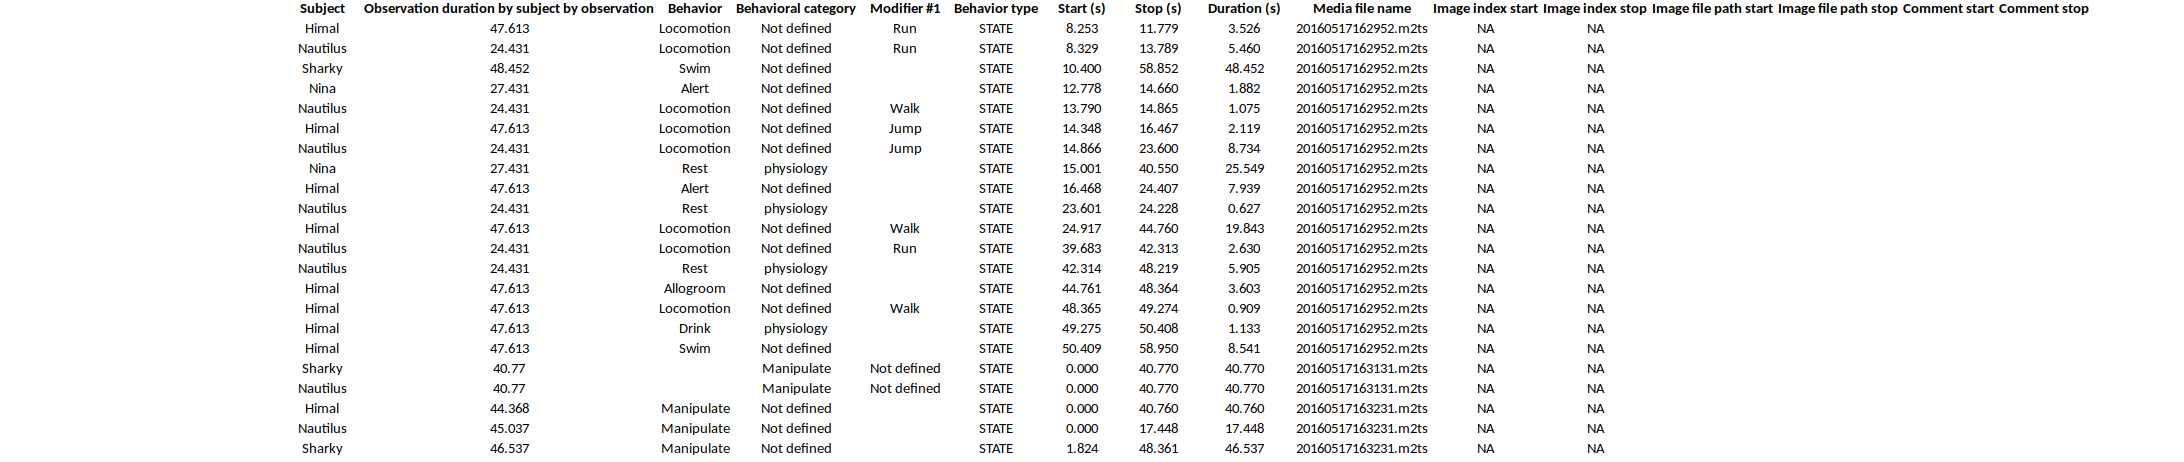
- Subject name
- Observation duration by subject
- Behavior
- Behavioral category (if any)
- Behavior modifier(s) (one column per modifier)
- Behavior type (STATE / POINT)
- Start (seconds)
- Stop (seconds)
- Duration (seconds, duration of the event for STATE events)
- Media file name (for media file observation, media in which the event occurs)
- Image index start (for observations from pictures, index of the image where the event starts)
- Image index stop (for observations from pictures, index of the image where the event stops)
- Image file path start (for observations from pictures, path of the image where the event stops)
- Image file path stop (for observations from pictures, path of the image where the event stops)
- Comment start
- Comment stop
Example of aggregated event export (TSV, CSV, XLSX, ODS, HTML):
Example of SQL export of aggregated events:
CREATE TABLE aggregated_events (id INTEGER PRIMARY KEY ASC, observation TEXT, subject TEXT, behavior TEXT, type TEXT, modifiers TEXT, start FLOAT, stop FLOAT,
comment TEXT, comment_stop TEXT, image_index_start INTEGER,image_index_stop INTEGER,image_path_start TEXT,image_path_stop TEXT);
INSERT INTO "aggregated_events" VALUES(1,'0001_a','Himal','Tear','STATE','Branches',0.0,30.199,'','','NA','NA',NULL,NULL);
INSERT INTO "aggregated_events" VALUES(2,'0001_a','Himal','Locomotion','STATE','Walk',30.2,32.4,'','','NA','NA',NULL,NULL);
INSERT INTO "aggregated_events" VALUES(3,'0001_a','Nautilus','Tear','STATE','Branches',0.0,32.4,'','','NA','NA',NULL,NULL);
INSERT INTO "aggregated_events" VALUES(4,'0001_b','Himal','Tear','STATE','Branches',0.0,30.199,'','','NA','NA',NULL,NULL);
INSERT INTO "aggregated_events" VALUES(5,'0001_b','Himal','Locomotion','STATE','Walk',30.2,32.4,'','','NA','NA',NULL,NULL);
INSERT INTO "aggregated_events" VALUES(6,'0001_b','Nautilus','Tear','STATE','Branches',0.0,31.4,'','','NA','NA',NULL,NULL);
INSERT INTO "aggregated_events" VALUES(7,'0002','Himal','Tear','STATE','Branches',0.0,33.898,'','','NA','NA',NULL,NULL);
INSERT INTO "aggregated_events" VALUES(8,'0002','Himal','Locomotion','STATE','',33.899,34.47,'','','NA','NA',NULL,NULL);
INSERT INTO "aggregated_events" VALUES(9,'0002','Sharky','Tear','STATE','Branches',0.0,30.688,'','','NA','NA',NULL,NULL);
INSERT INTO "aggregated_events" VALUES(10,'0002','Sharky','Locomotion','STATE','Walk',30.689,31.819,'','','NA','NA',NULL,NULL);
INSERT INTO "aggregated_events" VALUES(11,'0002','Nautilus','Tear','STATE','Branches',1.359,25.776,'','','NA','NA',NULL,NULL);
INSERT INTO "aggregated_events" VALUES(12,'0002','Nautilus','Carry objects','STATE','Branches',25.777,27.732,'','','NA','NA',NULL,NULL);
INSERT INTO "aggregated_events" VALUES(13,'0003','Nina','Locomotion','STATE','Walk',21.626,22.5,'','','NA','NA',NULL,NULL);
INSERT INTO "aggregated_events" VALUES(14,'0003','Nina','Manipulate','STATE','',0.0,21.625,'','','NA','NA',NULL,NULL);
Export events as behavioral sequences#
Observations > Export events as behavioral sequences
Behavioral strings can be used with the Behatrix program: Behatrix
Example:
# observation id: demo#1
# observation description:
# Media file name: video1.mp4, video2.mp4


Subject #1:
eat|jump|eat|jump

Subject #2:
eat|rest|jump|eat|jump
Export events as Praat TextGrid#
Observations > Export events as Praat TextGrid
Example:
File type = "ooTextFile"
Object class = "TextGrid"

xmin = 4.3
xmax = 113.988
tiers? <exists>
size = 2
item []:
    item [1]:
        class = "IntervalTier"
        name = "Subject #1"
        xmin = 4.3
        xmax = 10.0
        intervals: size = 1
        intervals [1]:
            xmin = 4.3
            xmax = 10.0
            text = "eat"
    item [2]:
        class = "IntervalTier"
        name = "Subject #2"
        xmin = 26.6
        xmax = 113.988
        intervals: size = 1
        intervals [1]:
            xmin = 26.6
            xmax = 113.988
            text = "eat"
Export events for analysis with JWatcher#
Observations > Export events for analysis with JWatcher
JWatcher is a powerful tool for the quantitative analysis of behavior.
Events coded with BORIS can be exported for analysis with JWatcher.
Click Observations > Export events > for analysis with JWatcher to export the coded events.
BORIS will ask you to select a directory. After that, for each combination of selected observation and selected subject, the following files will be created:
- the Focal Data File (.dat)
- the Focal Analysis Master File (.faf)
- the Focal Master File (.fmf)
These files can be used to analyze your observations with JWatcher.
Export events as Behaviors Binary Table#
Observations > Export events as Behaviors Binary Table
A time interval will be requested (in seconds). The observation will be checked every n seconds and the presence (1, absence: 0) of the selected behaviors will be exported in a table for each selected subject.
Example for a time interval of 1 second:
time    Alert     Drink    Locomotion   Swim
0.0     0         1        0            0
1.0     0         1        0            0
2.0     0         1        0            0
3.0     0         1        0            0
4.0     0         1        0            0
5.0     0         1        0            0
6.0     0         1        0            0
7.0     0         1        0            0
8.0     0         1        0            0
9.0     1         0        0            0
10.0    1         0        0            0
11.0    0         0        1            0
12.0    1         0        0            0
13.0    1         0        0            0
14.0    1         0        0            0
15.0    1         0        0            0
16.0    1         0        0            0
17.0    1         0        0            0
18.0    0         0        1            0
19.0    0         0        1            0
20.0    0         0        1            0
21.0    0         0        1            0
22.0    1         0        0            0
23.0    0         0        0            0
24.0    0         0        0            0
25.0    0         0        0            0
26.0    0         0        0            0
27.0    0         0        0            0
28.0    0         0        0            0
29.0    0         0        0            0
30.0    0         0        0            0
31.0    0         0        0            0
32.0    0         0        0            0
33.0    0         0        0            1
34.0    0         0        0            1
35.0    0         0        0            1
36.0    0         0        0            1
37.0    0         0        0            1
38.0    0         0        0            1
39.0    0         0        0            1
40.0    0         0        0            1
41.0    0         0        0            1
42.0    0         0        0            1
43.0    0         0        0            1
44.0    0         0        0            1
45.0    0         0        0            1
46.0    0         0        0            1
47.0    0         0        0            1
48.0    0         0        0            1
49.0    0         0        0            1
Extract clips from media files corresponding to coded events#
Sequences of media file corresponding to coded events can be extracted from media files:
-
Click on Observations > Extract clips from media files option.
-
Choose the observation(s).
-
Select the subjects and events to be extracted. Modifiers con be included
-
Select the time interval around the events (in seconds, the default value is 0).
-
Select the tracks to include in clips:
- Video and audio
- Only video
- Only audio
-
Select a destination directory that will contain the extracted clips.
The time offset will be substracted from the starting time of event and added to the stopping time. All the extracted clips will be saved in the selected directory followind the file name format:
{observation id}_{player}_{subject}_{behavior}_{start time}-{stop time}
If modifiers are included:
{observation id}_{player}_{subject}_{behavior}_{start time}-{stop time}_{modifiers concatenated with +}
Extract frames corresponding to coded events#
The frames corresponding to coded events can be extracted and saved as images.
-
Click on Observations > Extract frames from media files option.
-
Choose the observation(s).
-
Select the subjects and events to be extracted. Modifiers con be included
-
Select the time interval around the events (in seconds, the default value is 0).
-
Select the image format:
- JPG - small size / low quality
- PNG - big size / high quality
-
Select a destination directory that will contain the extracted frames.
Export transitions matrix#
3 transitions matrix outputs are available: The matrix of frequencies of transitions, the matrix of frequencies of transition after each behavior and the matrix of number of transitions.
Matrix of frequencies of transitions#
This matrix contains the frequencies of total transitions. The sum of all frequencies must be 1.
Example of frequencies of transitions matrix:
eat   sleep     walk
eat        0.0   0.286    0.143
sleep    0.143     0.0    0.143
walk     0.286     0.0      0.0
In this matrix you can see that the eat behavior precedes the sleep behavior with a frequency of 0.286 of the total number of transitions.
Matrix of frequencies of transitions after behavior#
This matrix contains the frequencies of transitions after each behavior. The sum of each row must be 1.
Example:
eat    sleep     walk
eat     0.0    0.667    0.333
sleep   0.5      0.0      0.5
walk    1.0      0.0      0.0
In this example you can see that sleep follows eat with a frequency of 0.667 and walk follows with a frequency of 0.333.
Matrix of number of transitions#
This matrix contains the number of transitions after each behavior.
Example:
eat   sleep   walk
eat       0       2      1
sleep     1       0      1
walk      2       0      0