Analysis and plot#
Time budget analysis#
The Time budget analysis can be performed by behavior (including or excluding modifiers) or by behavioral category. Choose the option from the Analysis menu.
The Time budget analysis can be performed on one or more observations. If you select more than one observation, you can choose either a global time budget analysis that includes all selected observations or a separate time budget analysis for each observation.

Choose Yes to group all observations into a single time budget analysis.
The Analysis > Time budget menu option shows the time budget for the events of the selected observations. Select the subjects and behaviors you want to include in the time budget analysis:
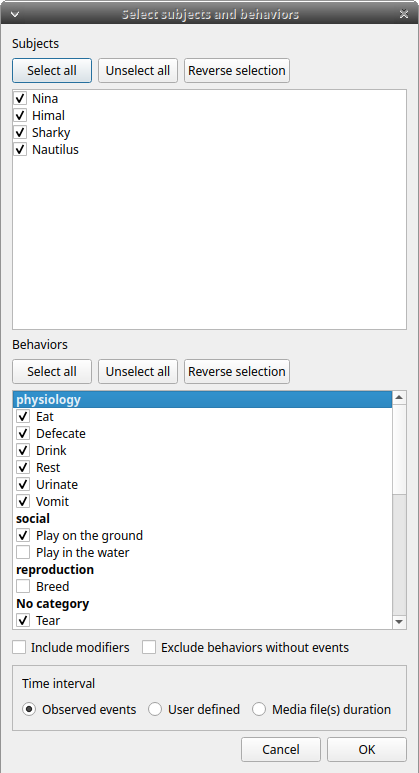
All behaviors can be selected or deselected by clicking the Category name (in bold).
You can choose whether to include behavior modifiers in the time budget analysis and to exclude behaviors without coded events.
The time budget analysis can be restricted to part of the observation:
- Full observation(s): the analysis will be made on the full observation length.
- Limit to time interval: use the Start time and End time boxes to select starting time and ending time.
- Limit to observed events: the analysis will be made from the first observed event to the last observed event.
The last dialog window allows you to subtract the duration of one or more behaviors from the total duration of the observation. This can be useful, for example, if you have defined an "out-of-sight" code in your ethogram:

For each subject and behavior, the results include the total number of occurrences, the total duration (for behaviors defined as state events), the mean duration (for behaviors defined as state events), the standard deviation of duration, the mean inter-event interval, the standard deviation of the inter-event interval, and the percentage of the total observation duration. All durations are expressed in seconds (s).

The time budget results can be saved in various formats for further analysis:
-
Plain text in tabular format
- Tab Separated Values (TSV)
- Comma Separated Values (CSV)
- Hyper Text Markup language (HTML)
-
Spreadsheet files
- OpenDocument (ODS)
- Microsoft Excel (XLSX, XLS)
-
Pandas dataframe (to be loaded in Python with the pickle module)
-
R dataframe (to be loaded in R with readRDS function)
Important
If a STATE behavior has an odd number of coded events, BORIS will report UNPAIRED instead of results.
Time budget by behavioral category#
The Time budget by behavioral category is similar to the Time budget analysis except that the behaviors are grouped into behavioral categories.

Synthetic time budget#
The synthetic time budget is similar to the time budget analysis, but with fewer parameters and a different organization of results. Results from all selected observations are organized in columns on a single page. Two parameters are currently provided: number of occurrences and total duration (for behaviors defined as state events).

All duration times are expressed in seconds (s).
The time budget results can be saved in various formats for further analysis:
-
Plain text in tabular format
- Tab Separated Values (TSV)
- Comma Separated Values (CSV)
- Hyper Text Markup language (HTML)
-
Spreadsheet files
- OpenDocument (ODS)
- Microsoft Excel (XLSX, XLS)
Synthetic time budget with time bin#
The synthetic time budget with time bin is similar to the Synthetic time budget, but the results are divided into time bins.
Analysis > Synthetic time budget with time bin
Choose a time bin size (in seconds)


The time budget with time bin results can be saved in various formats for further analysis:
-
Plain text in tabular format
- Tab Separated Values (TSV)
- Comma Separated Values (CSV)
- Hyper Text Markup language (HTML)
-
Spreadsheet files
- OpenDocument (ODS)
- Microsoft Excel (XLSX, XLS)
Inter-rater reliability#
The Cohen's kappa coefficient can be calculated (Analysis > Inter-rater reliability > Cohen\'s kappa).
After selecting 2 observations and a time window (in seconds) for the analysis (the default value is 10 seconds), Cohen's kappa will be displayed in the results window.

Implementation of IRR Cohen's Kappa in BORIS#
If a time window of n seconds is set, the 2 selected observations will be checked every n seconds for agreement or disagreement, from the first event to the last event of the 2 observations. In the case of a point event, the presence of a corresponding event in the other observation will be verified using a time window of n seconds centered on the point event.
An IRR Cohen's Kappa analysis is available in the GSEQ program (http://www2.gsu.edu/~psyrab/gseq). For this the coded events can be exported as aggregated events in SDIS format. See export aggregated events.
Similarities#
Needleman-Wunsch similarity
Co-occurrence#
This function allows you to determine the co-occurrence of 2 behaviors.
Advanced event filtering#
This function allows filtering events from one or more observations by selecting subjects, behaviors and logical operators.
To use the filter, select a subject, select a behavior and click on the button with the green arrow on the side of the behaviors list. The tuple subject/behavior will be added in the filter text edit. A complex filter query can be constructed by adding parenthesis and logical operator & (AND) or | (OR) for combining various subjects and behaviors.
Example of a summarized output showing the occurrences of Himal resting while Nautilus in alert:

Example of a detailed output showing the overlapping intervals while Himal rests and Nautilus is in alert:

The same subject can be used multiple times in the query with OR or AND (in the case of non-exclusive behaviors):

An unlimited number of conditions can be used:

Parentheses can be used to group logical conditions into blocks:

The results can be saved in a Tab Separated Values (TSV) file using the Save results button. Other formats may be added in the future.
Latency#
The latency will analyze the time between one or more markers (arbitrary behaviors(s)) and other behaviors.
Plugins#
BORIS can load Python and R analysis plugins. See Analysis plugins for plugin configuration, loading order, and plugin authoring details.