Plot#
Plot events#
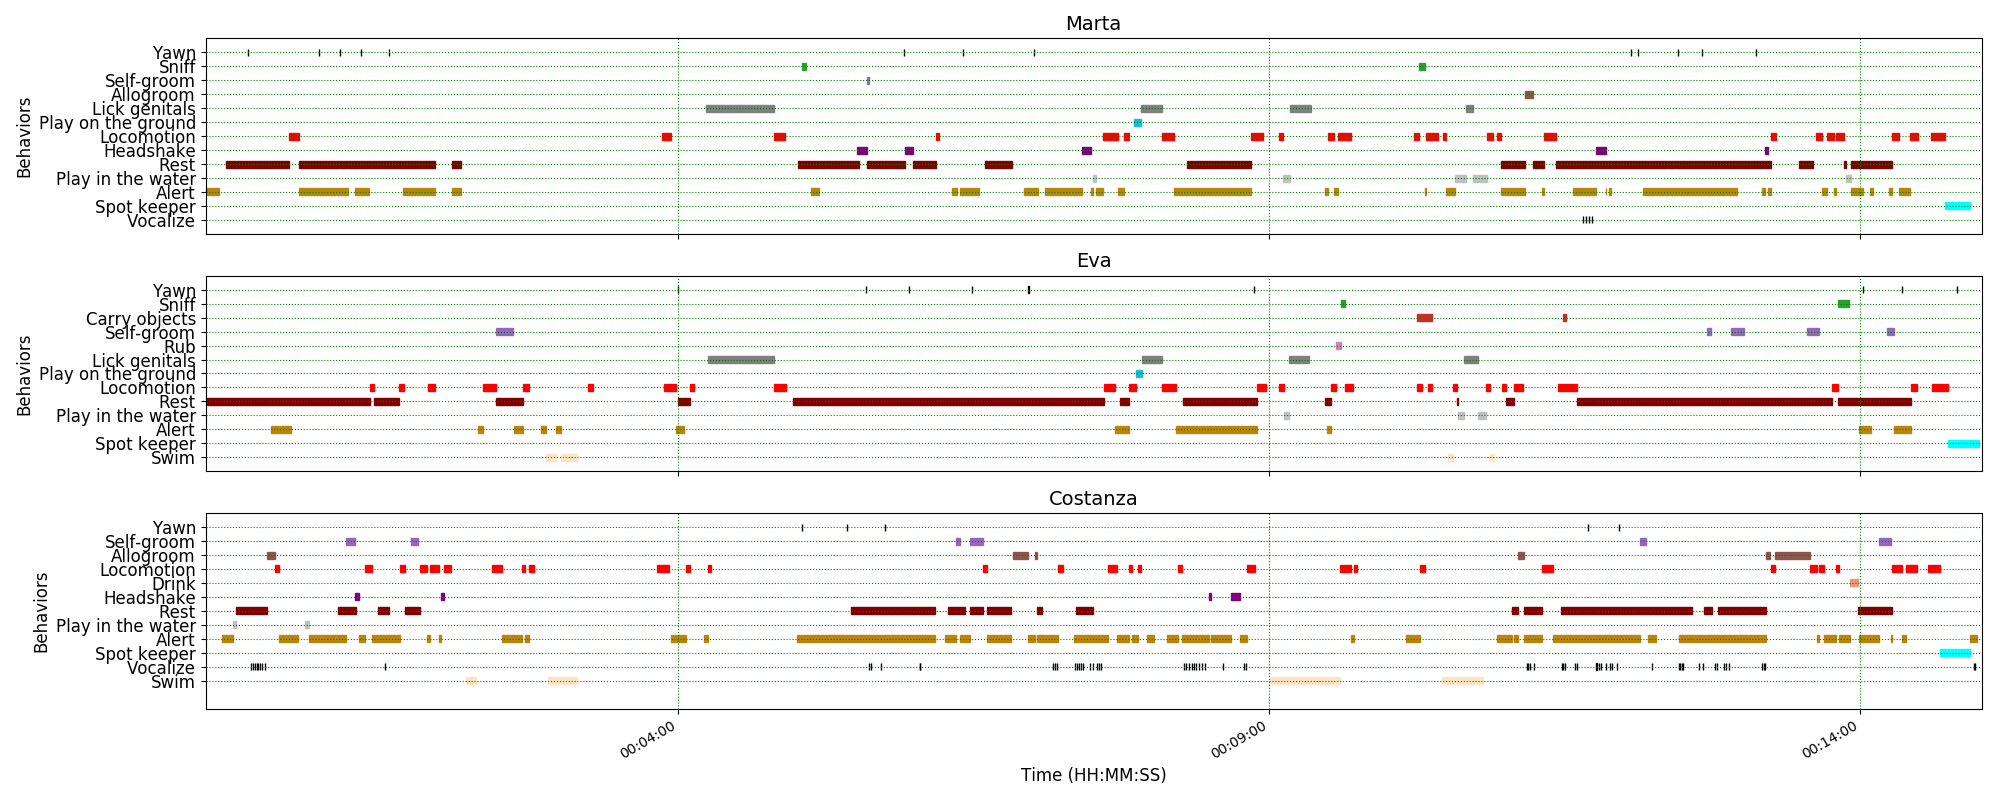
The recorded events can be plotted along a time axis.
Analysis > Plot > Plot events
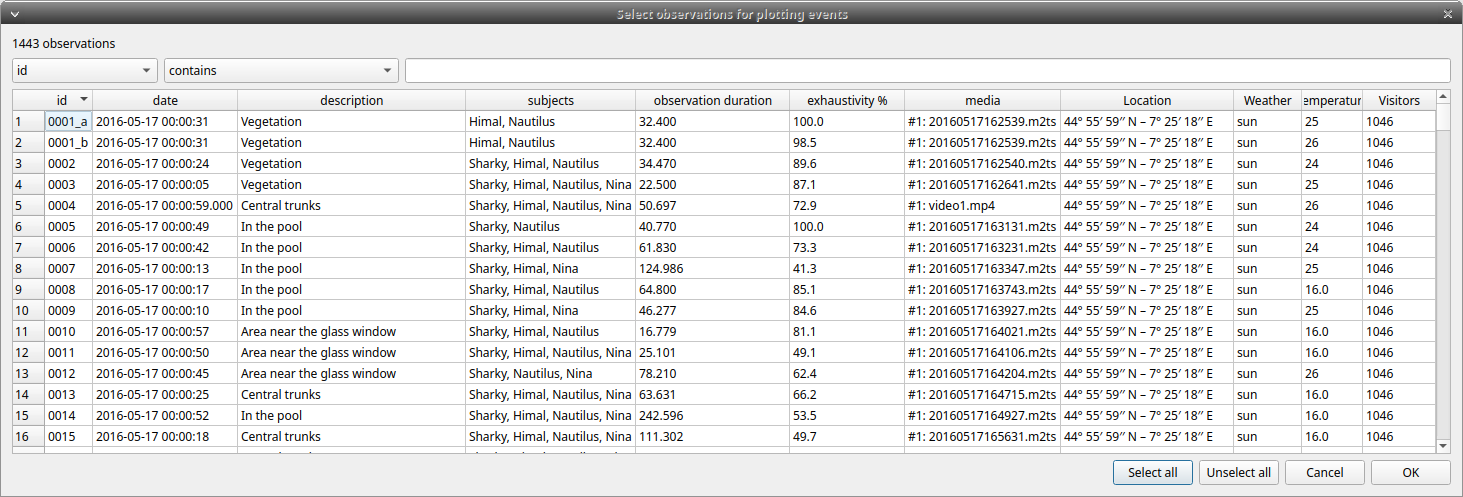
Select the observations you want to plot. If more than one observation are selected BORIS will ask you for a directory where to save the plots.
The subjects and behaviors you want to include in the plot can be selected in the following window:
You can choose to include or not the behavior modifiers (if any) and to exclude behaviors without coded events.
The time interval can be selected (See time budget)
The plot can be exported in various formats like bitmap (PNG, JPG, TIFF) or vectorial graphic (SVG, PDF, EPS, PS). The SVG format can be further edited with the Inkscape vector graphics editor.
Important
If a STATE behavior has an odd number of coded events, you will see this error message: "The STATE behavior XXX is not paired"
This function creates one plot by subject on one figure.
The color of behaviors can be customized. See plot colors
Plot time budget#
The duration and number of occurences can be plotted for each subject and behavior.
Analysis > Plot > Plot time budget
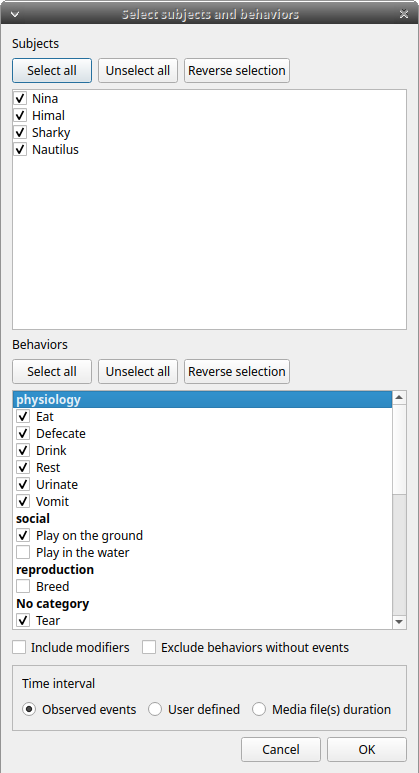
The subjects and behaviors you want to include in the plot can be selected in the following window:
The behavior modifiers can not be included in the plot for now.
The time interval can be selected (See time budget)
The plot can be exported in various formats like bitmap (PNG, JPG, TIFF) or vectorial graphic (SVG, PDF, EPS, PS). The SVG format can be further edited with the Inkscape vector graphics editor.
Important
If a STATE behavior has an odd number of coded events, you will see this error message: "The STATE behavior XXX is not paired"
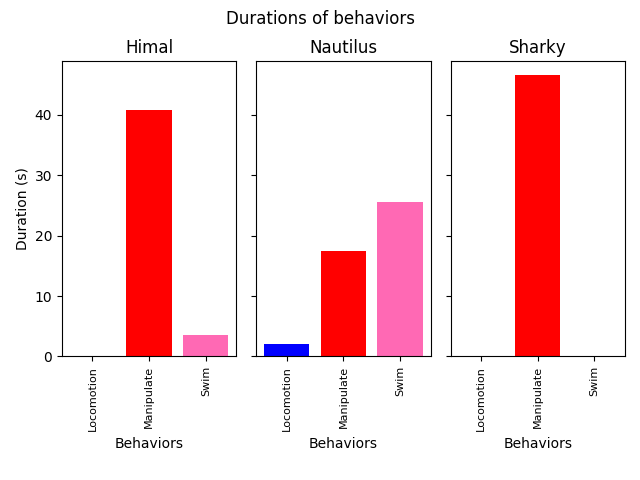
This function creates 2 plots with all subjects for each observation:
- a plot of the behavior durations for the behaviors defined as STATE event.
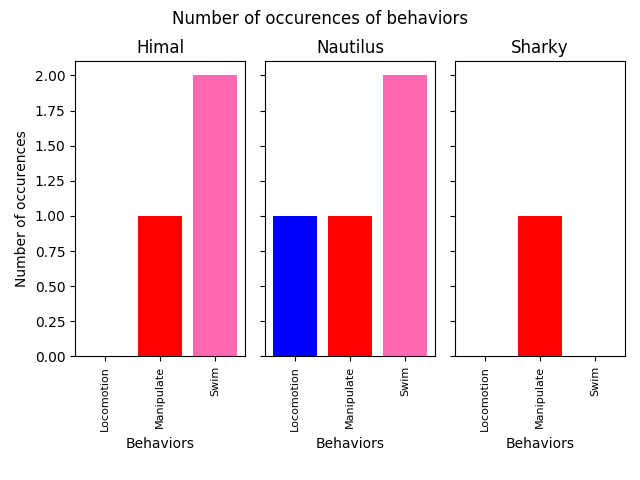
- a plot of the number of occurences for all the behaviors.
The color of behaviors can be customized. See plot colors